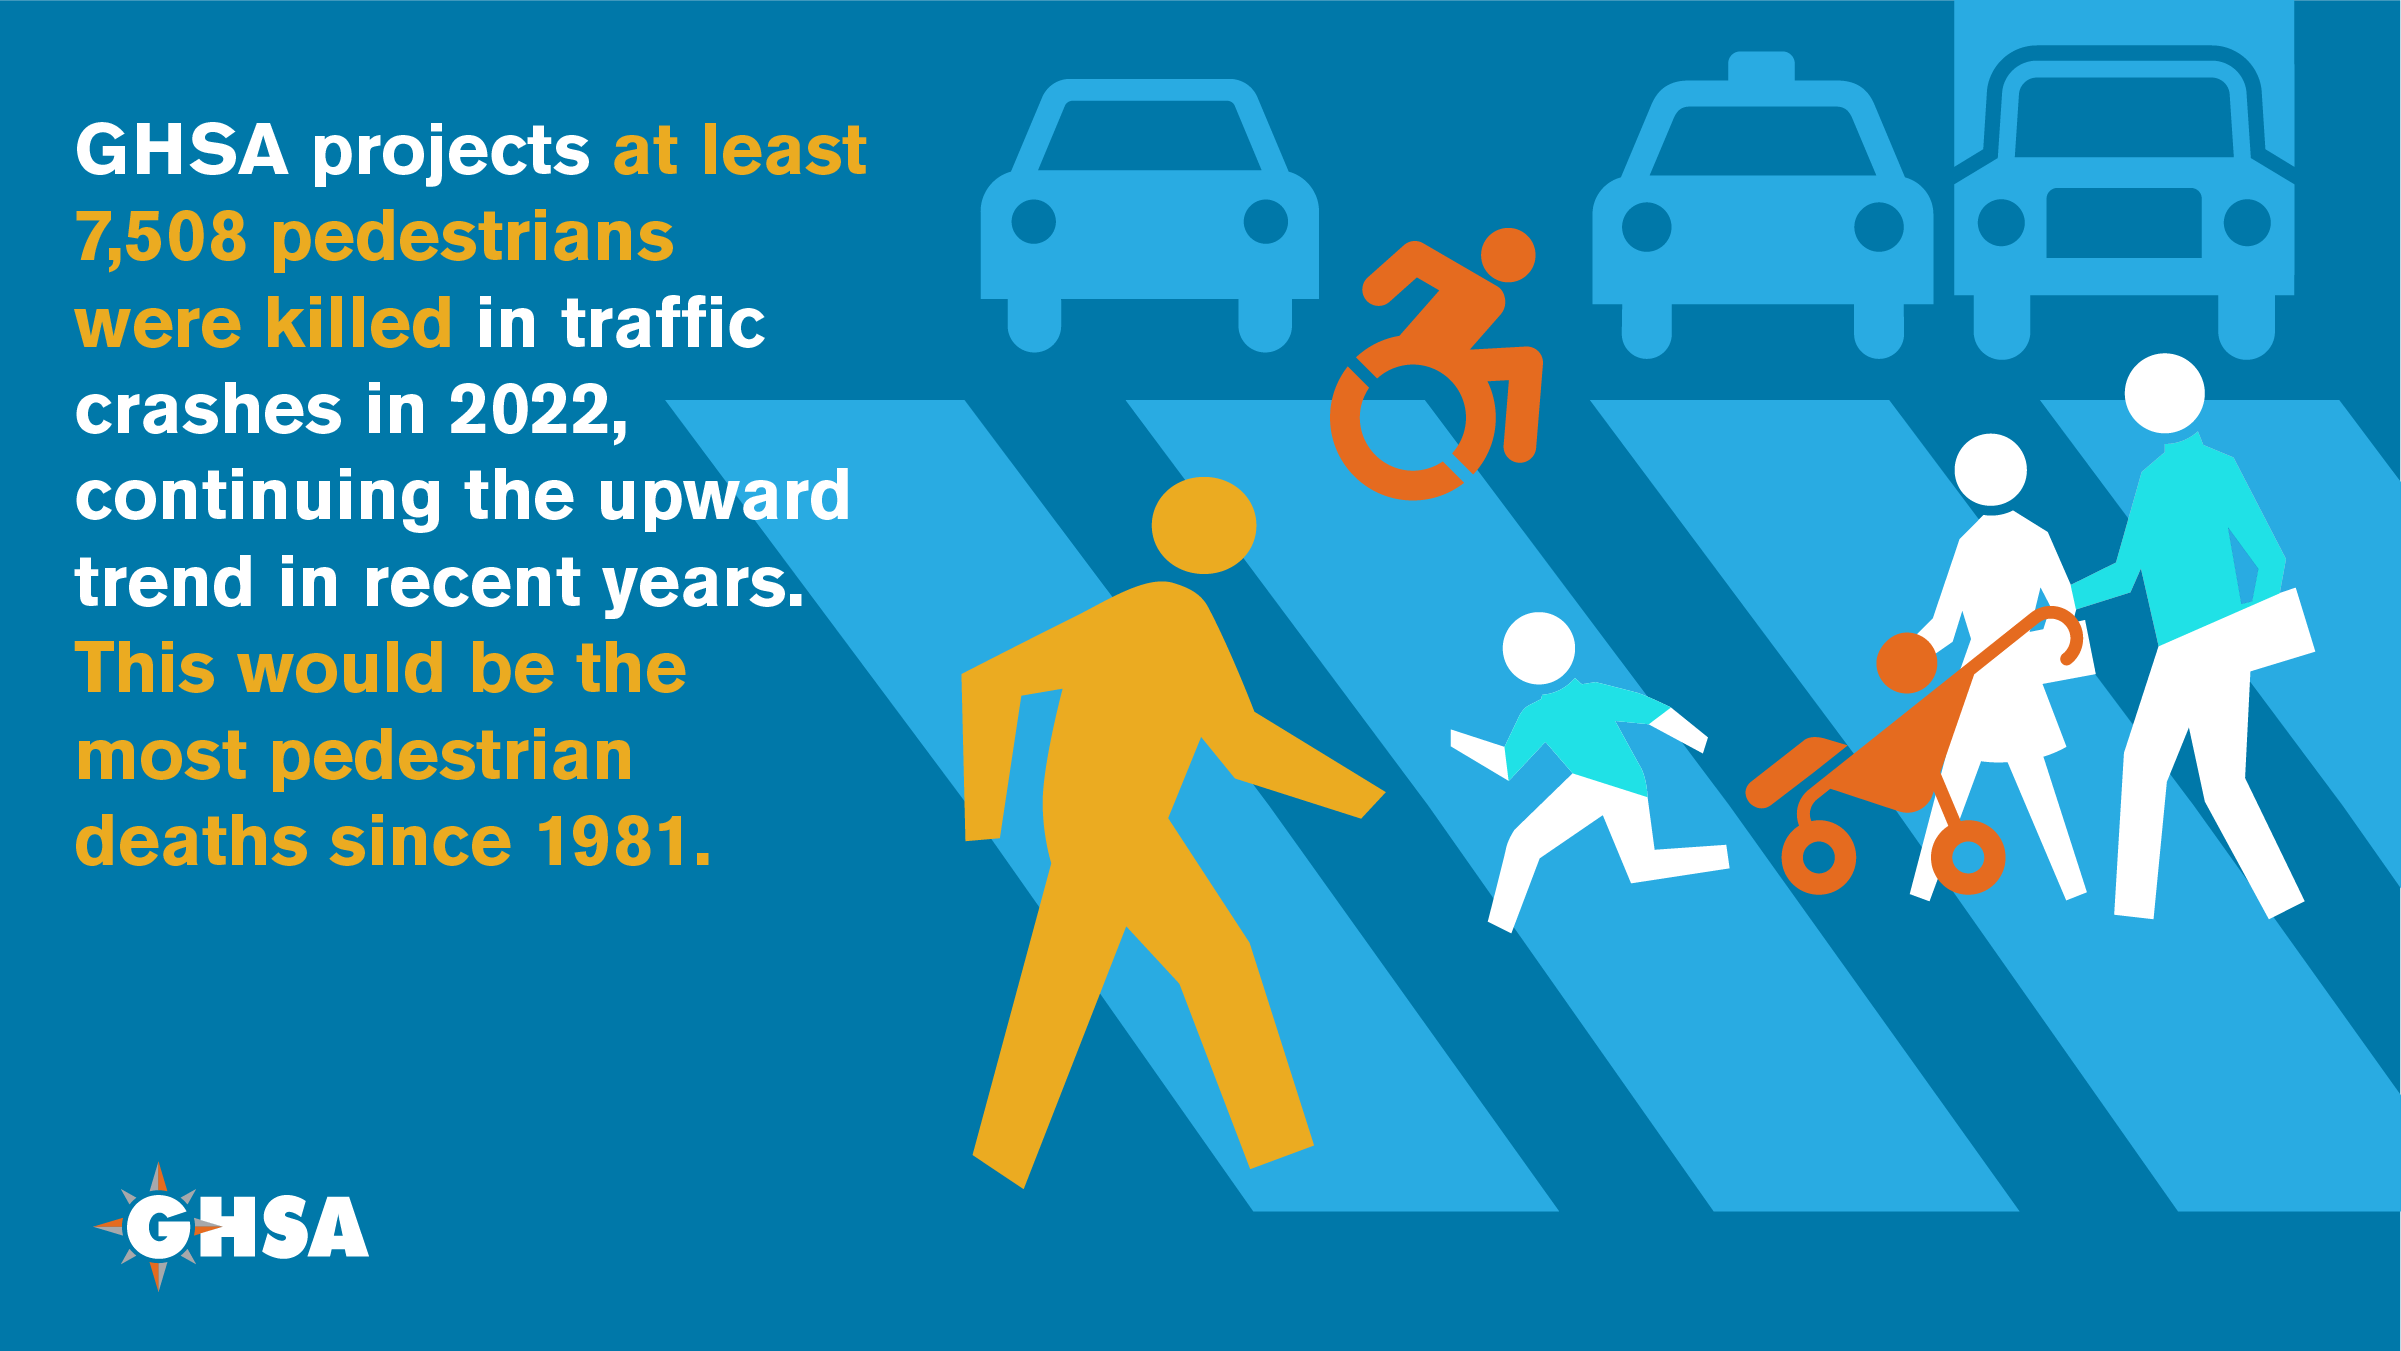
GHSA's annual Spotlight report, Pedestrian Traffic Fatalities by State: 2022 Preliminary Data, offers a comprehensive look at state and national trends in pedestrian deaths in 2022. The report projects that drivers struck and killed at least 7,508 people walking in 2022 – the highest number since 1981 and an average of 20 deaths every day.
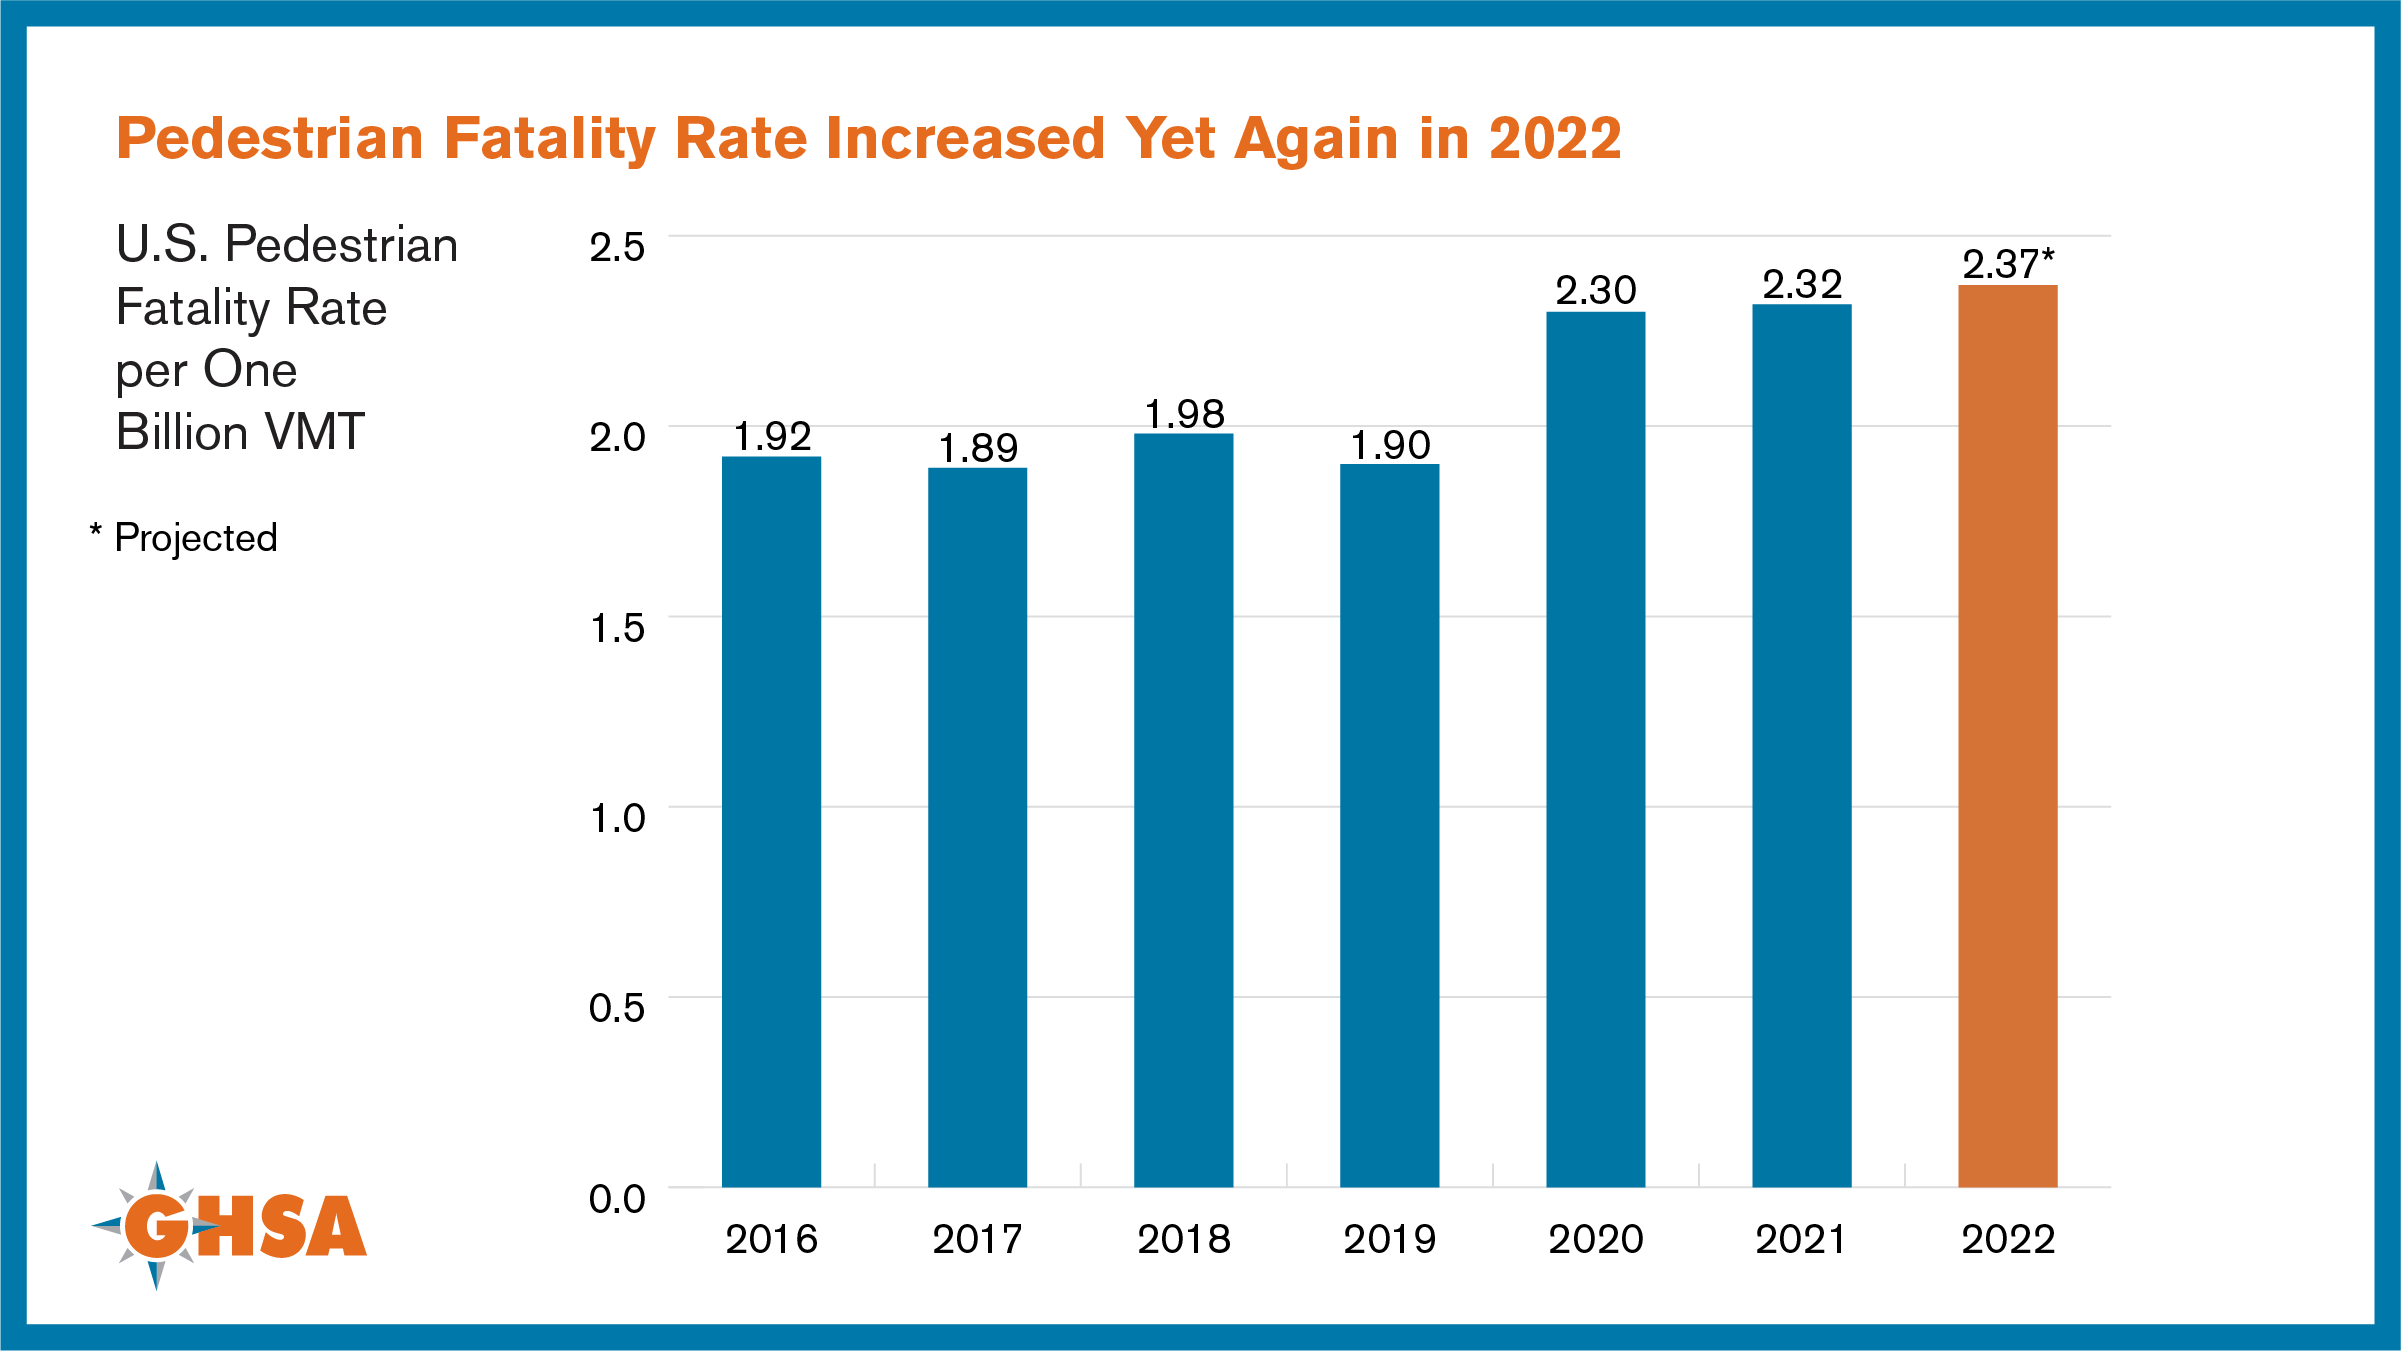
GHSA previously issued a report finding that 3,434 pedestrians were killed on U.S. roadways in the first half of 2022, based on preliminary data reported by State Highway Safety Offices. A second report analyzing state-reported data for all of 2022 found that roadways continue to be incredibly deadly for pedestrians. There were 2.37 pedestrian deaths per billion vehicle miles traveled (VMT) in 2022, up yet again and continuing a troubling trend of elevated rates that began in 2020.
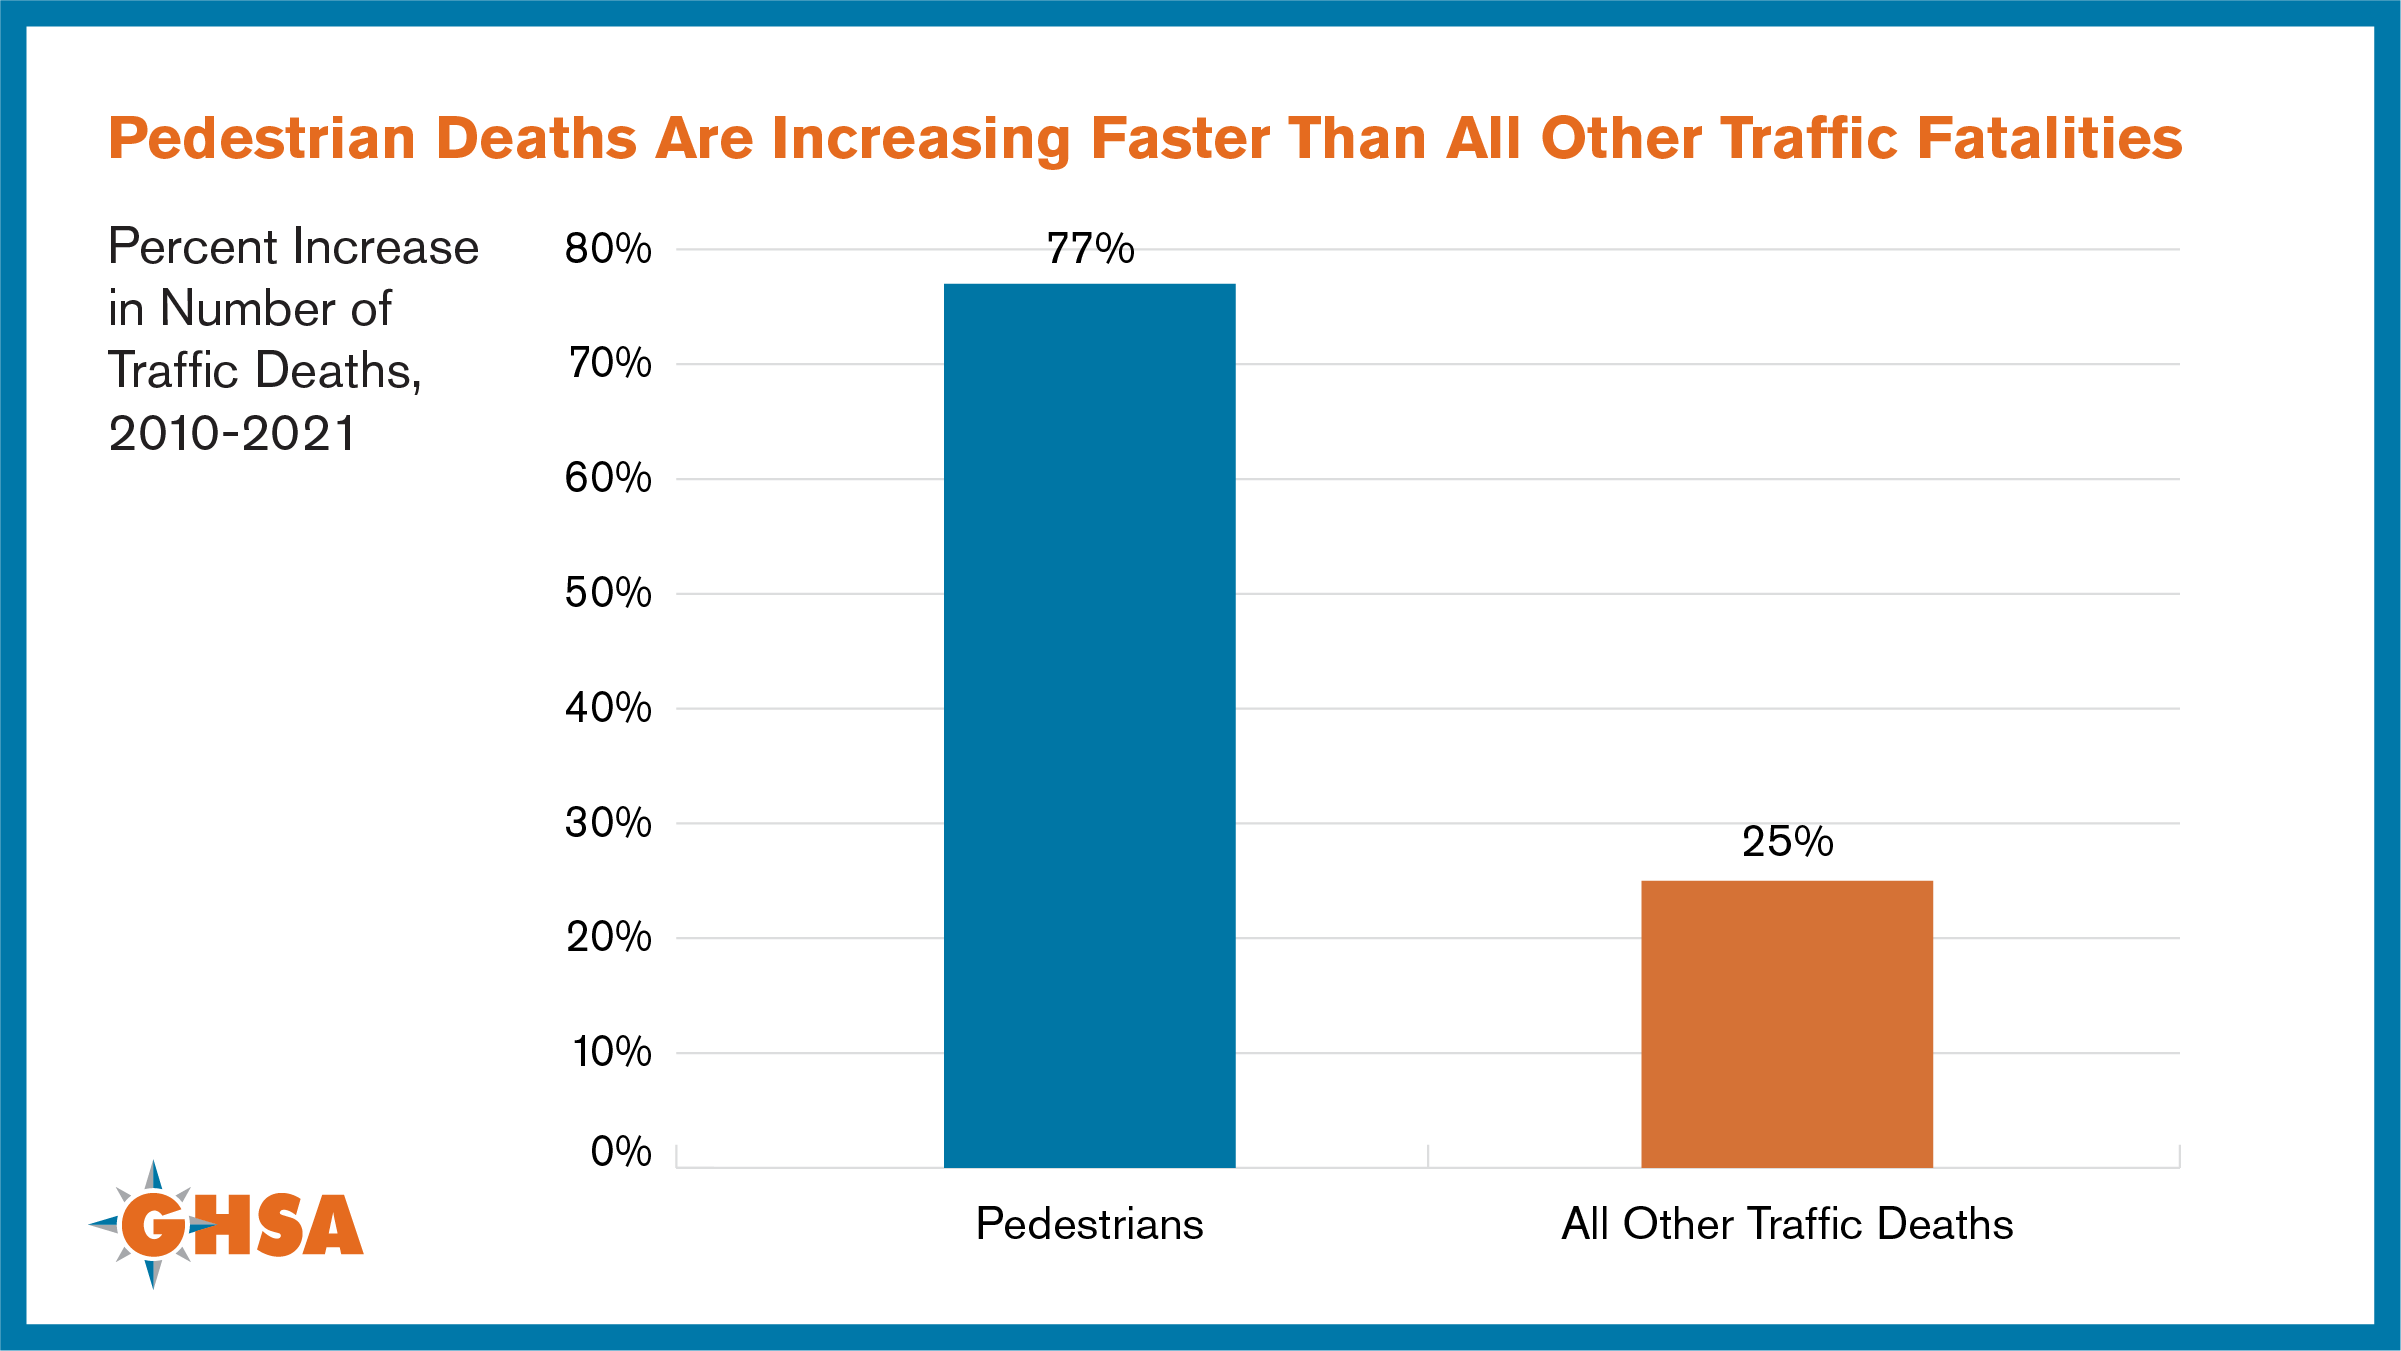
The report also includes an analysis of 2021 data from the National Highway Traffic Safety Administration’s Fatality Analysis Reporting System to provide additional context on when, where and how drivers strike and kill people on foot. This analysis uncovered a shocking safety disparity for people walking: Pedestrian deaths rose a troubling 77% between 2010 and 2021, compared to a 25% rise in all other traffic fatalities. The data analysis was conducted by Elizabeth Petraglia, Ph.D., of research firm Westat.
To combat this pedestrian safety crisis, GHSA supports a comprehensive solution based on the Safe System approach outlined in the U.S. Department of Transportation’s National Roadway Safety Strategy (NRSS). Each of the five elements of this approach – safe road users, safe vehicles, safe speeds, safe roads and post-crash care – contribute in different but overlapping ways to provide a multi-layered safety net that can protect people on foot as well as other road users. The report includes examples of how states are utilizing Safe System principles to improve pedestrian safety.